Data Visualization & Graphic Communication
A selection of explorations in the communication of data and information through graphic design
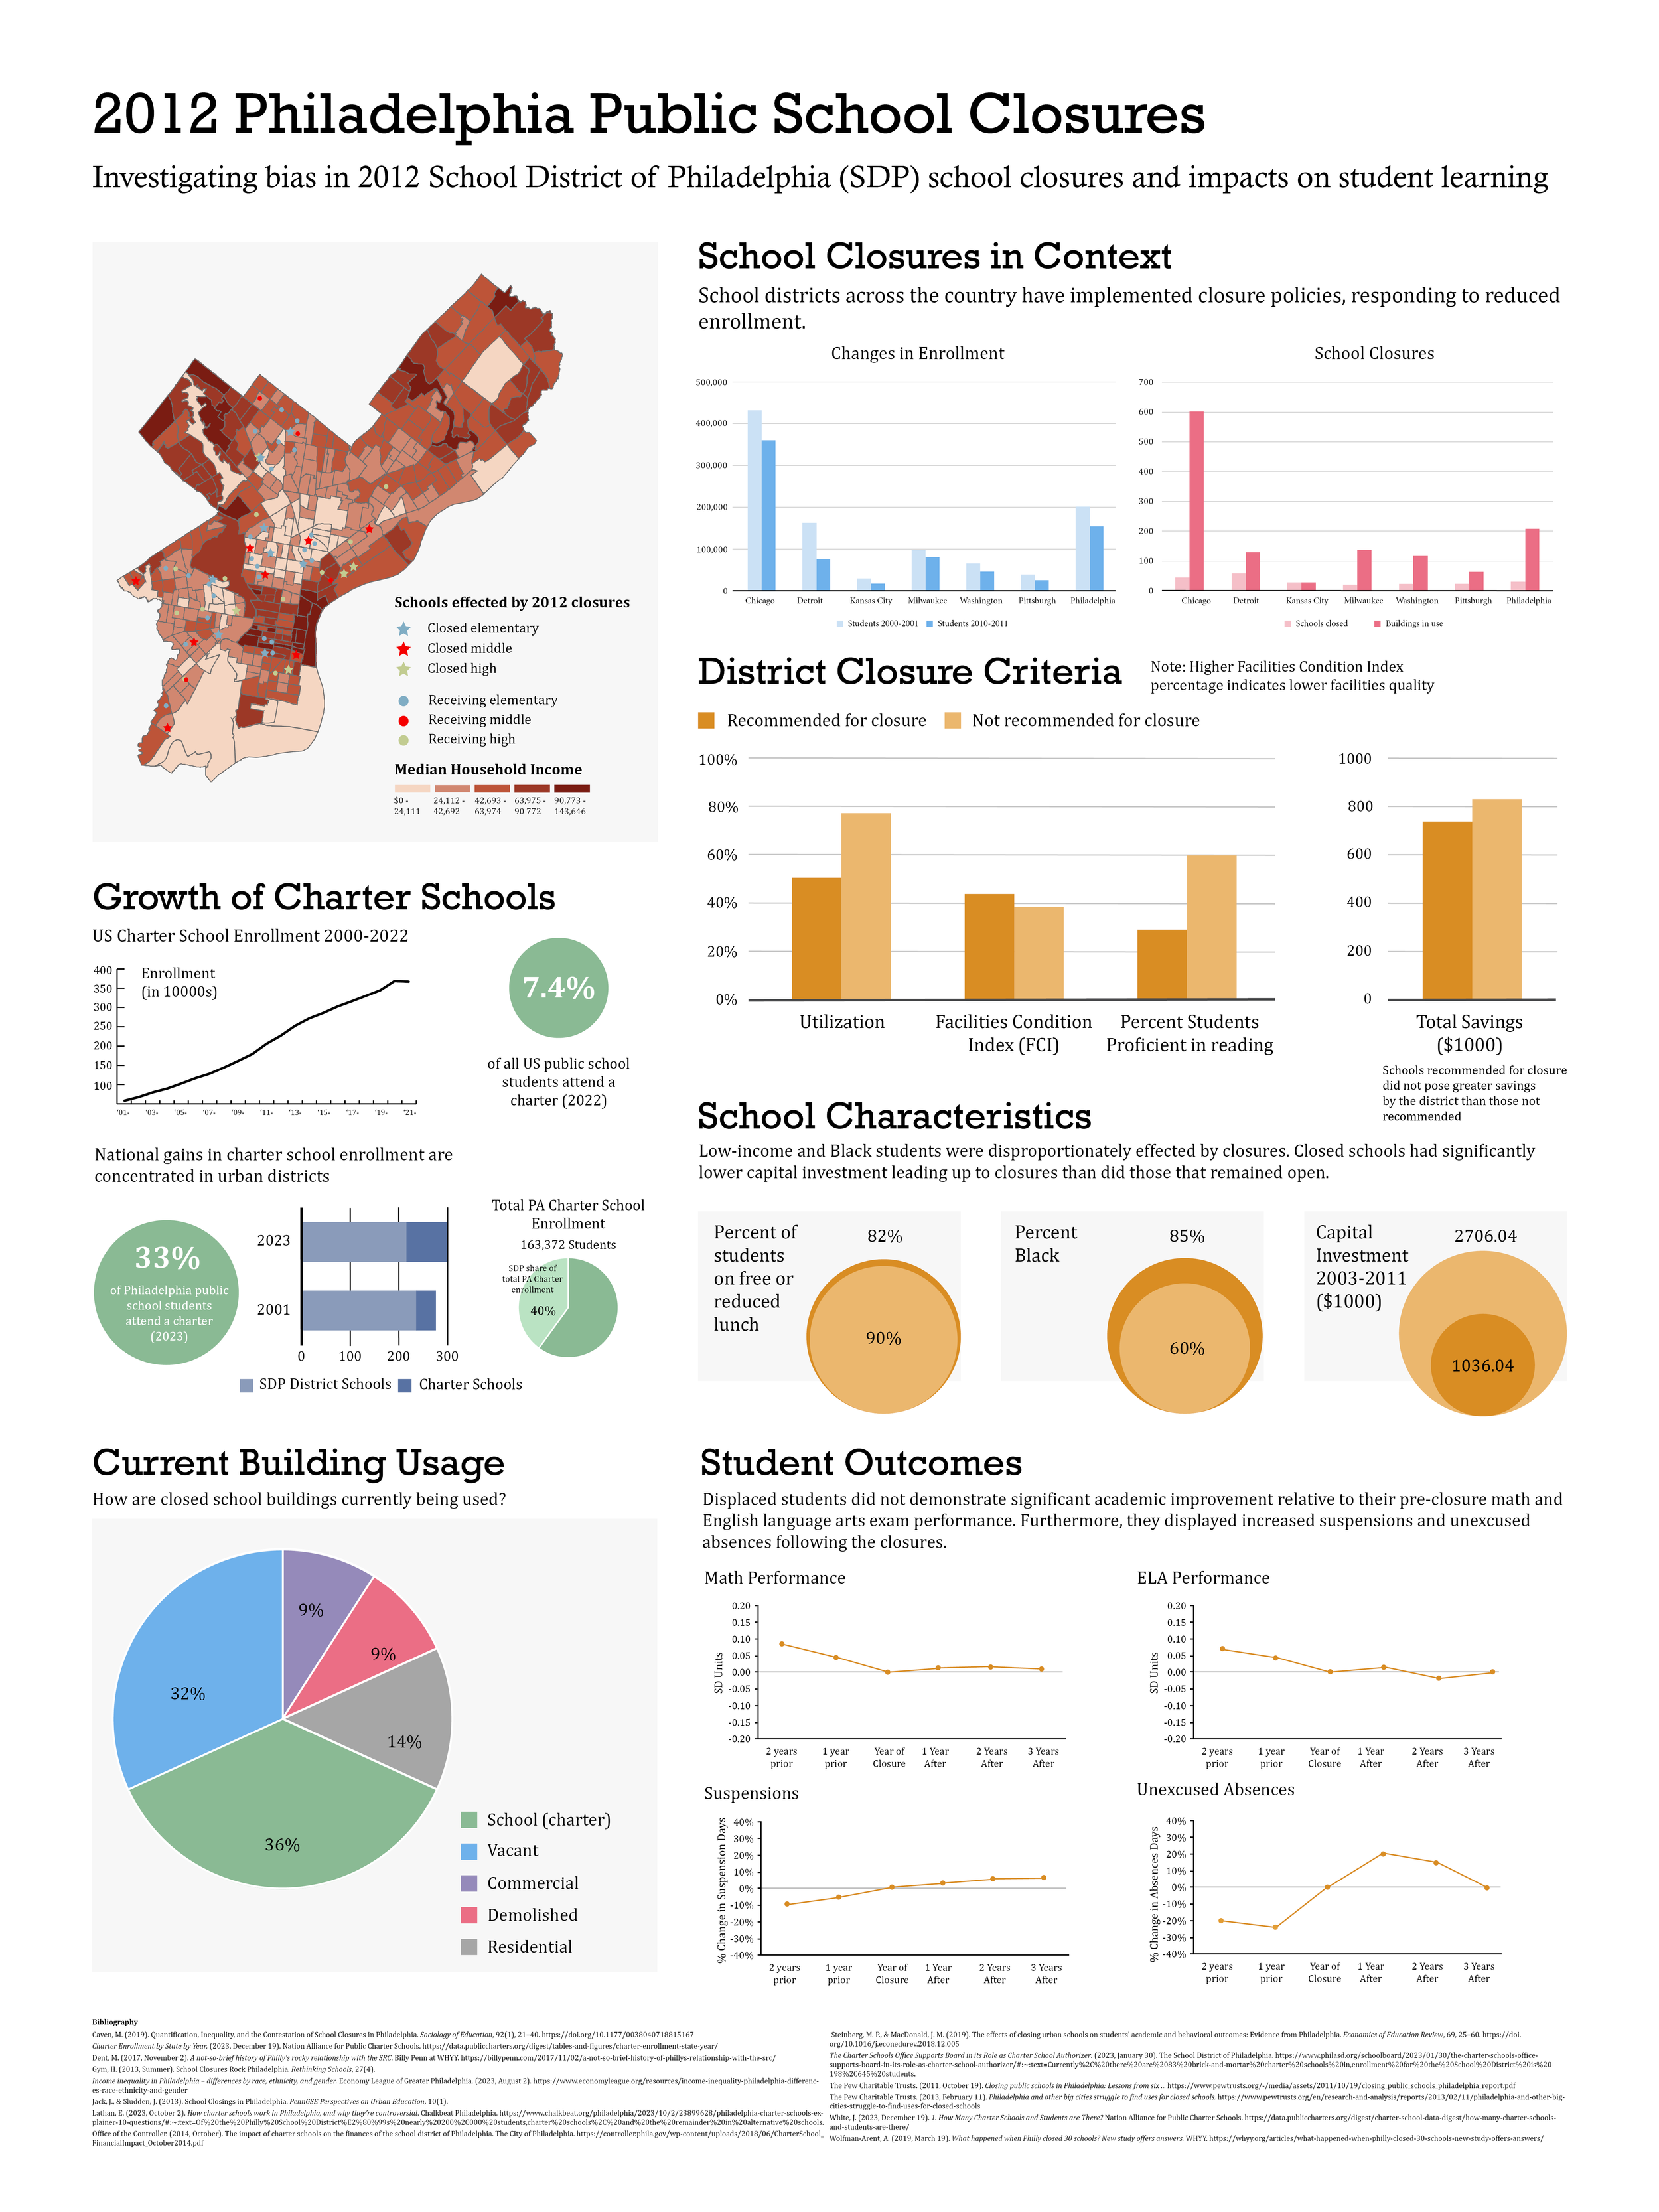
Creator/Consumer
This project was an exploration of the evolution of user-generated content on the web. I employed a variety of data visualization strategies, combining text and images to communicate a multifaceted history of the internet as we know it.
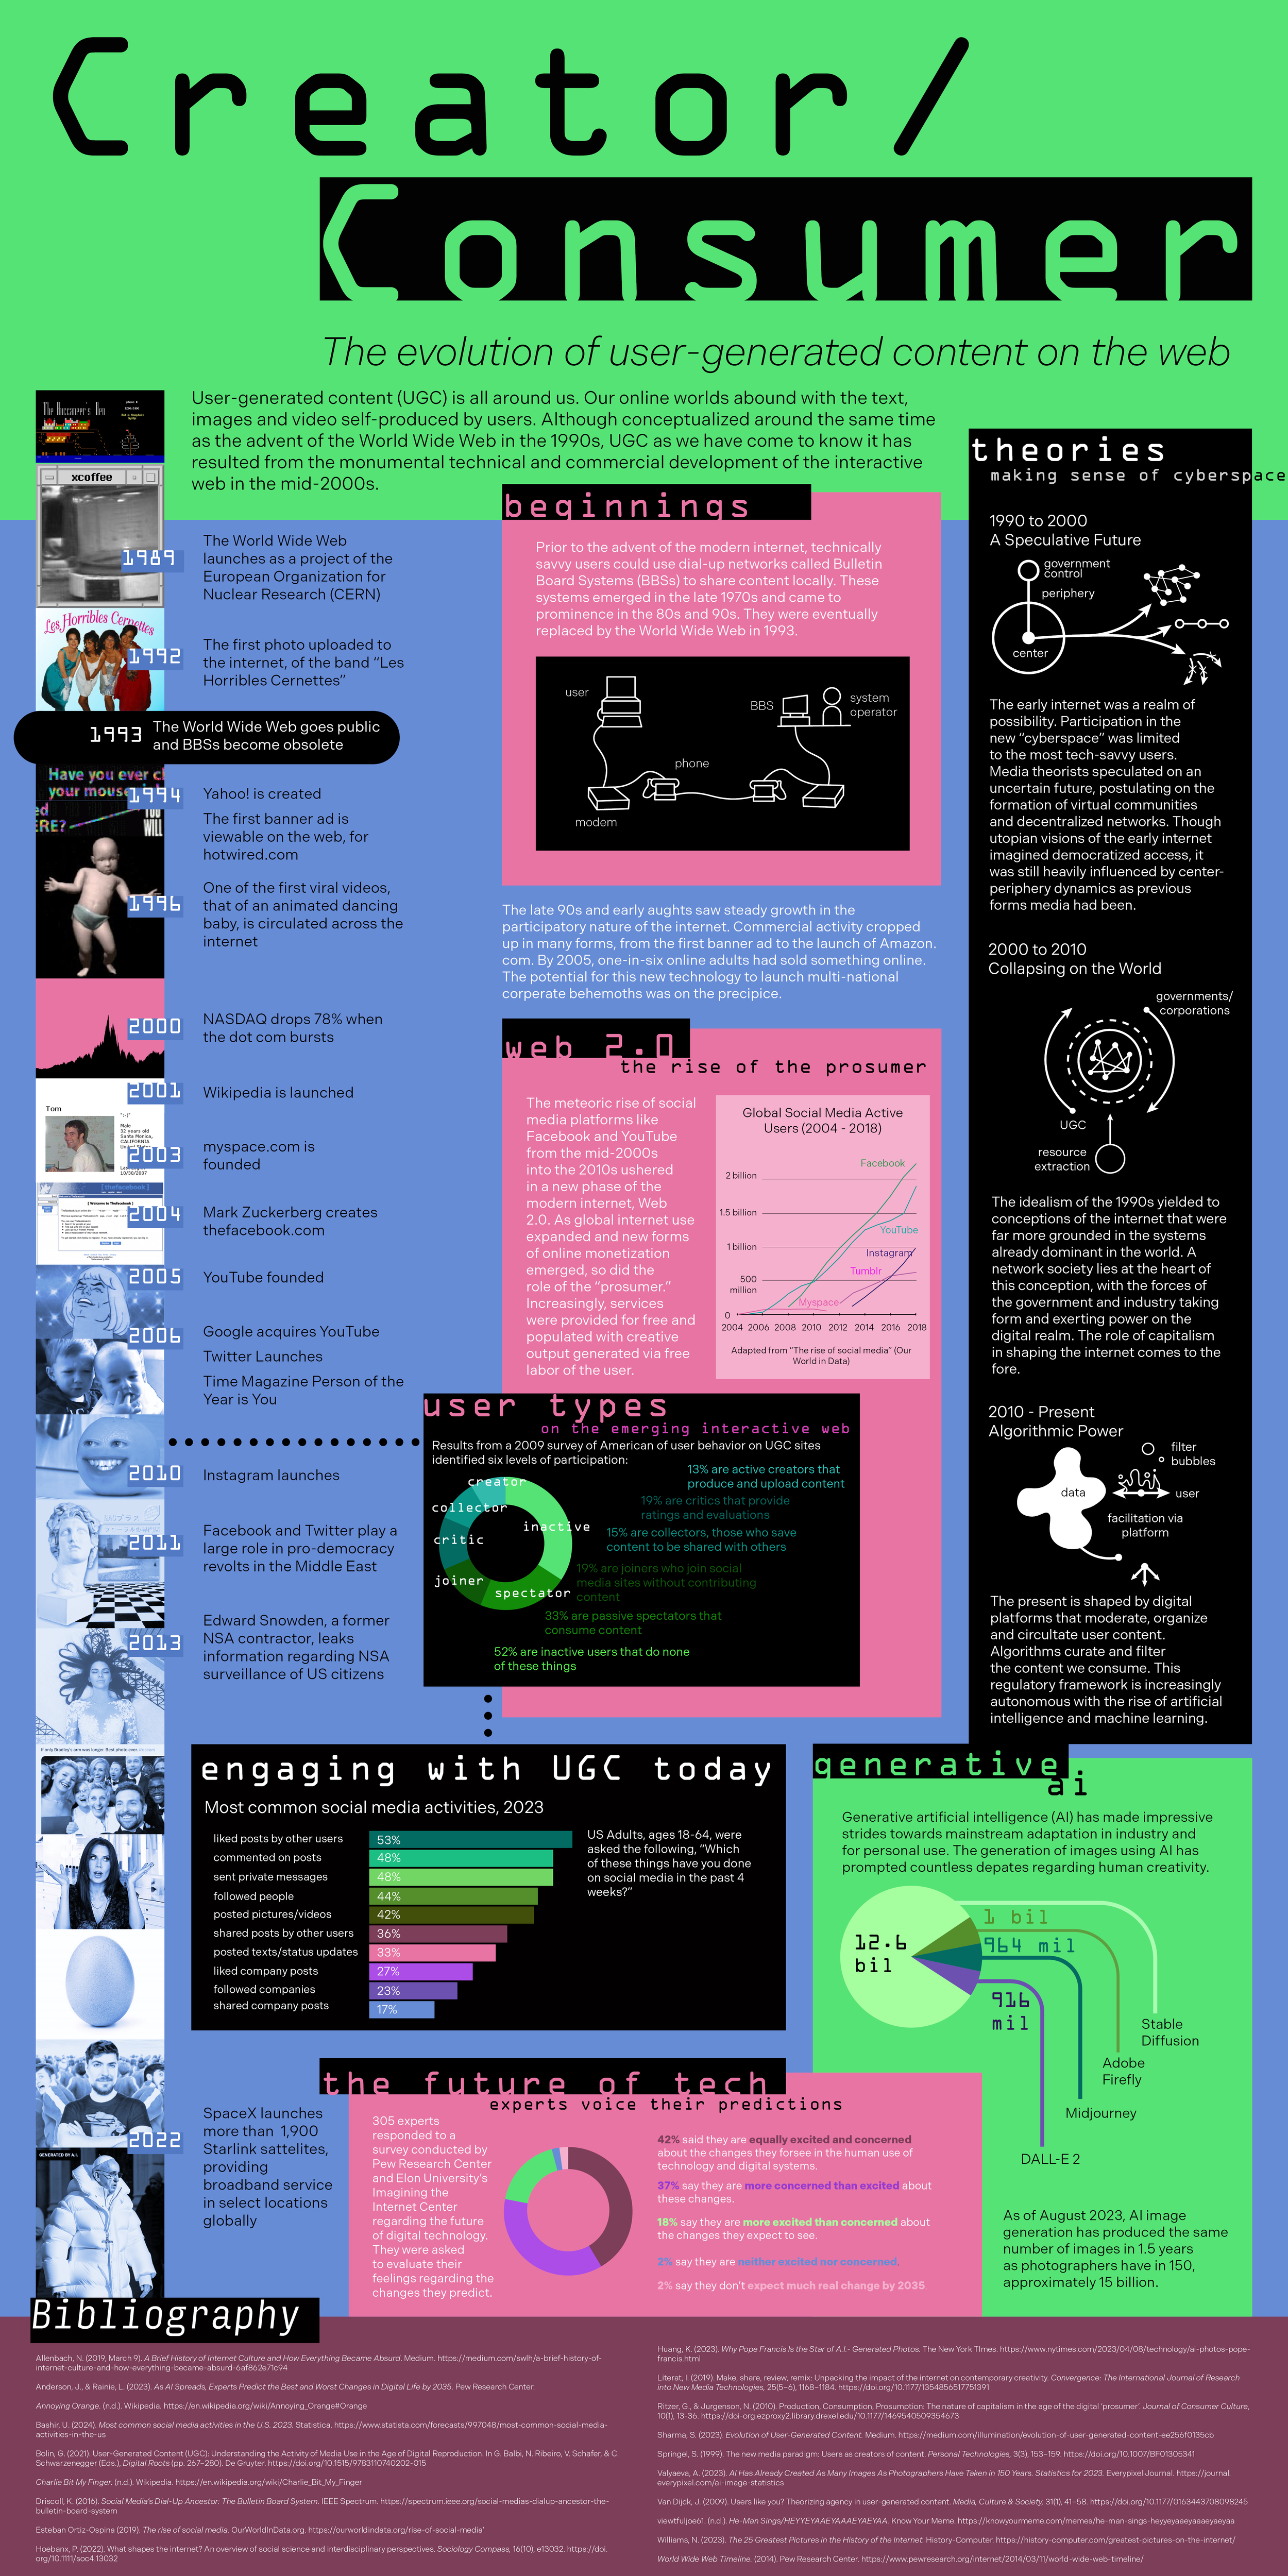
Organism & Territory
The objective for this project was to develop a framework and graphic language for communicating the relationship between an organism and its territory. My chosen organism was the Western Huckleberry and the Northwestern alpine region where it flourishes. Drawing from a number of highly specified academic sources, I explored facets of this plant’s social and ecological role across distinct regions of North America.
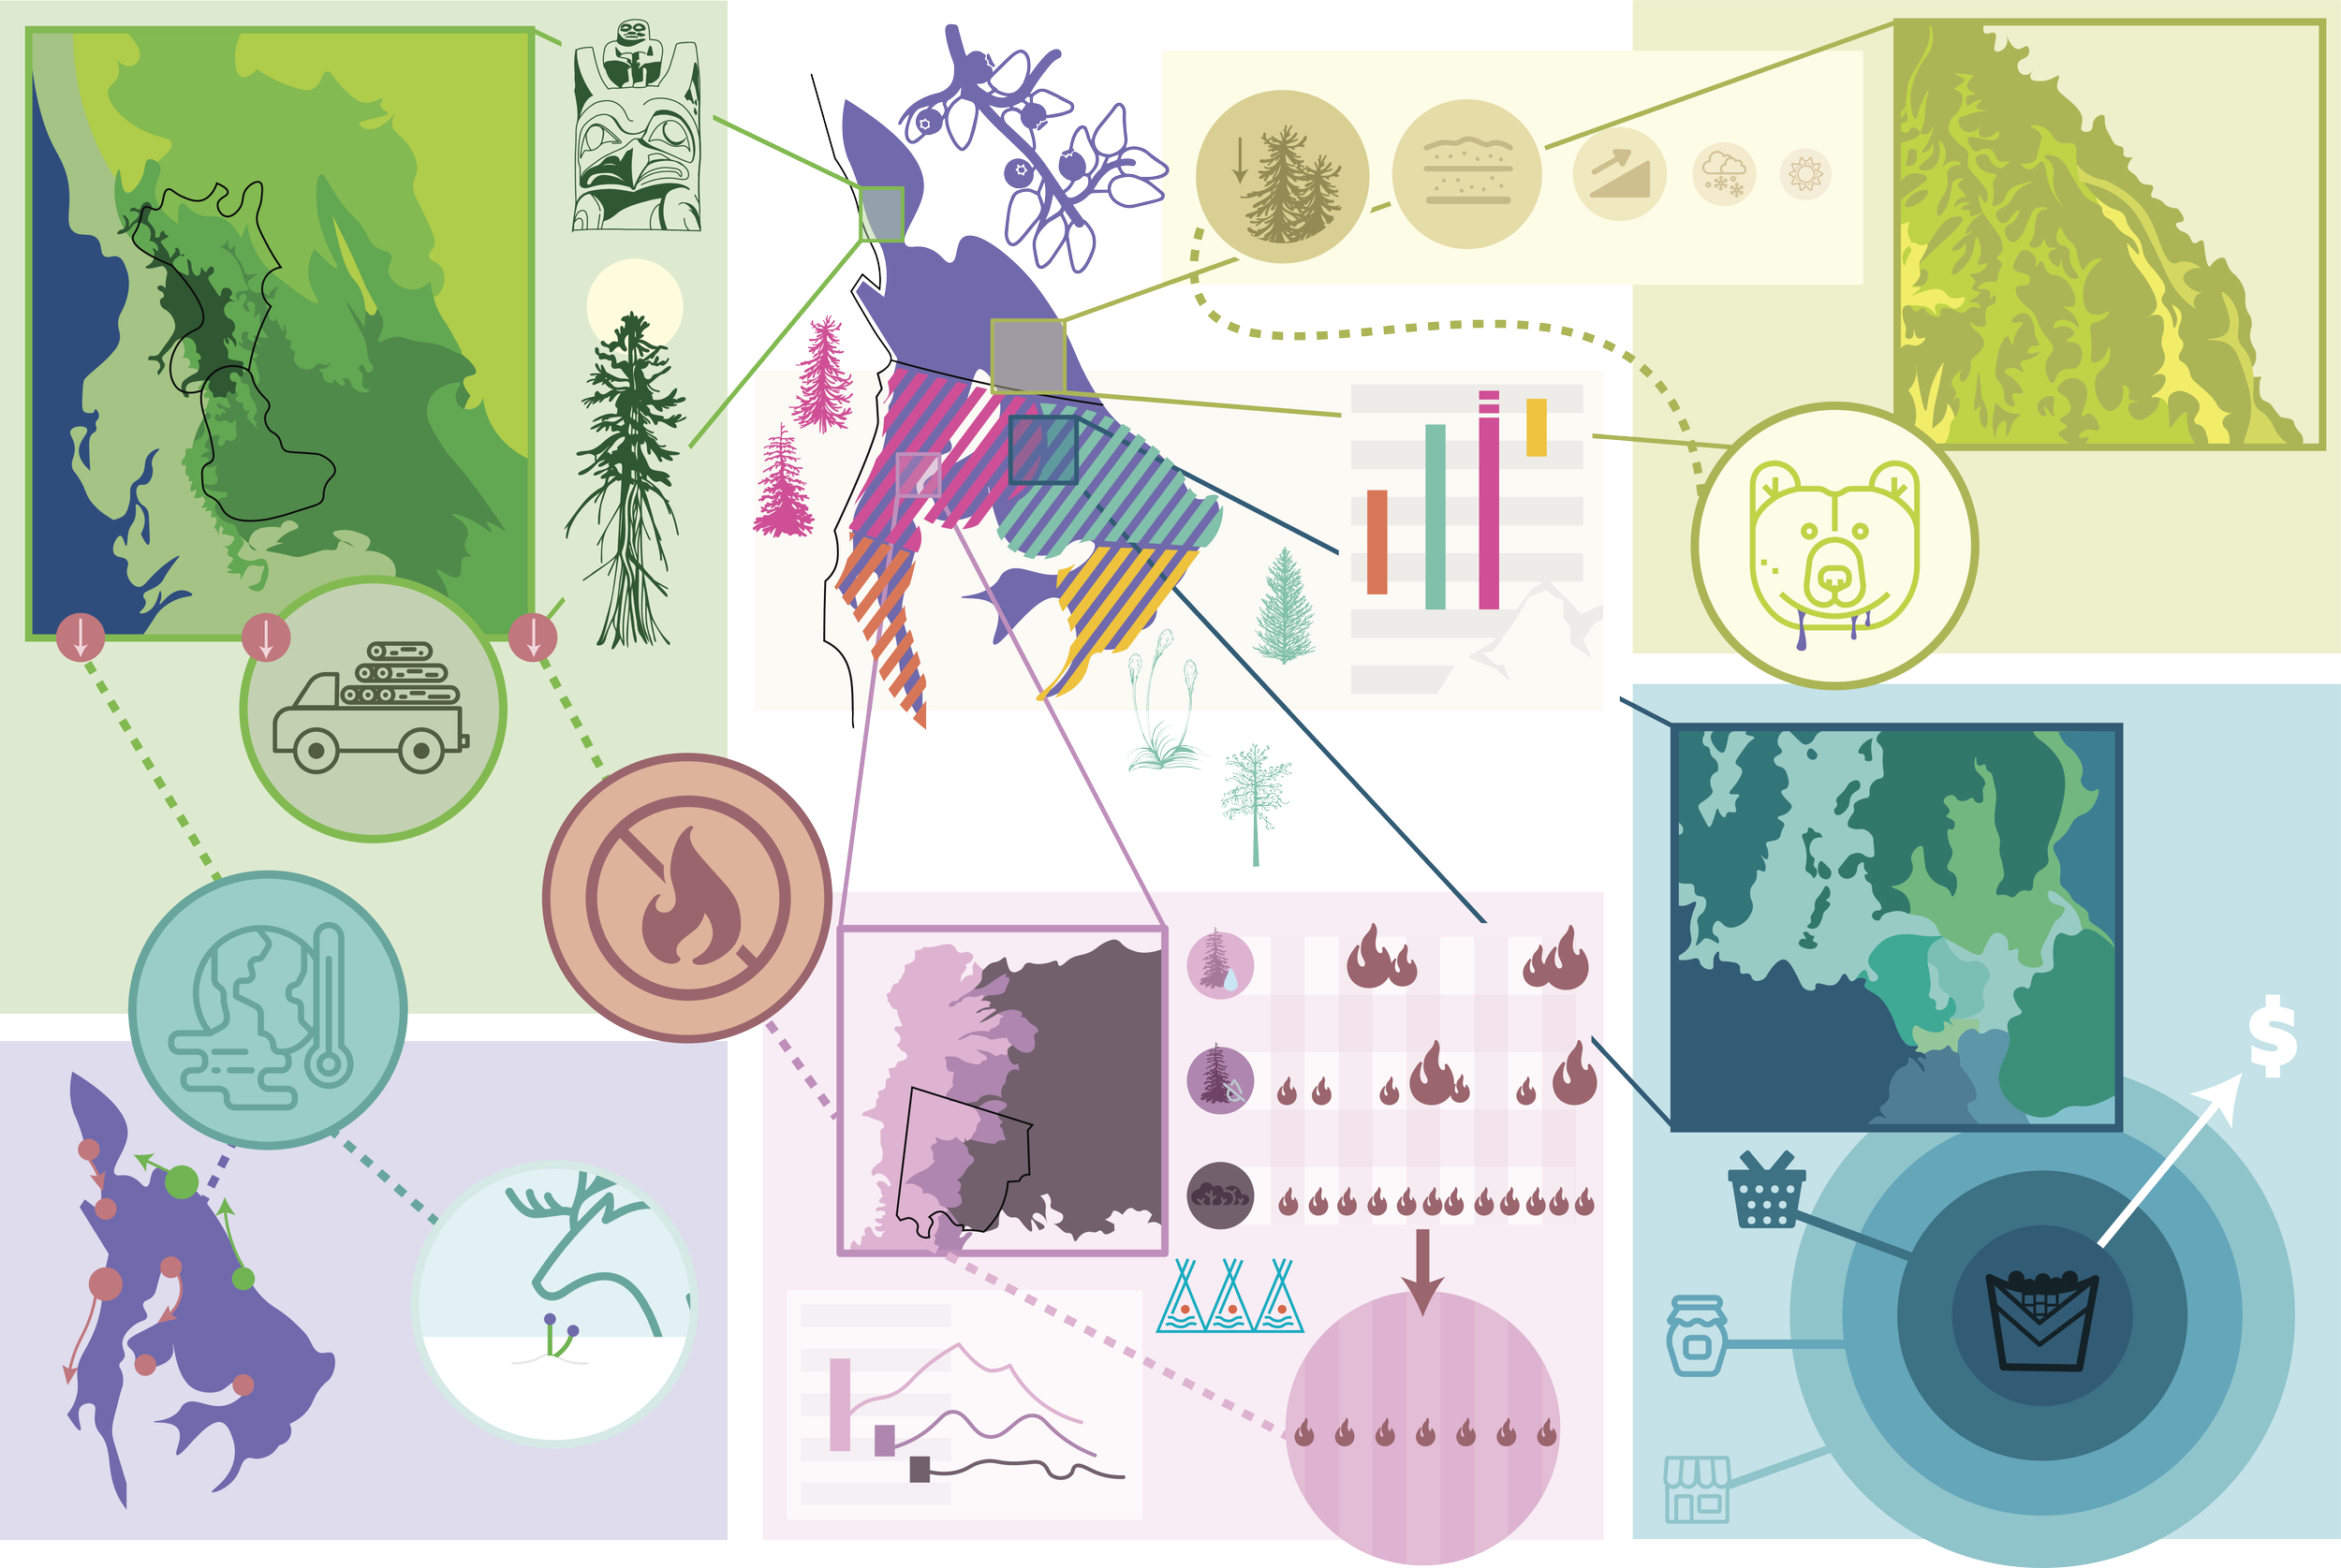
Visualizing Power
How can we better understand power and bias through the process of data representation. That was the purpose behind this quantitative exploration of school closures in Philadelphia.